Case Shiller: National Home Prices Hit New Low in 2011 Q1: "S&P/Case-Shiller released the monthly Home Price Indices for March (actually a 3 month average of January, February and March).
This includes prices for 20 individual cities and and two composite indices (for 10 cities and 20 cities), plus the Q1 2011 quarterly national house price index.
Note: Case-Shiller reports NSA, I use the SA data.
From S&P:National Home Prices Hit New Low in 2011 Q1
 Click on graph for larger image in graph gallery.
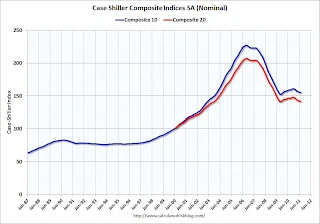
The first graph shows the nominal seasonally adjusted Composite 10 and Composite 20 indices (the Composite 20 was started in January 2000).
The Composite 10 index is off 31.8% from the peak, and down 0.1% in March (SA). The Composite 10 is still 1.6% above the May 2009 post-bubble bottom (Seasonally adjusted).
The Composite 20 index is off 31.6% from the peak, and down 0.2% in March (SA). The Composite 20 is only 0.1% above the May 2009 post-bubble bottom seasonally adjusted, and at a new post-bubble low not seasonally adjusted (NSA).
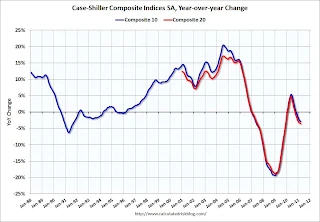
 The second graph shows the Year over year change in both indices.
The Composite 10 SA is down 2.8% compared to March 2010.
The Composite 20 SA is down 3.5% compared to March 2010.
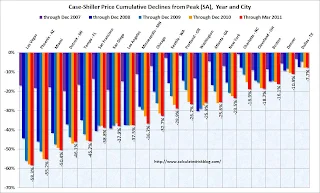
The third graph shows the price declines from the peak for each city included in S&P/Case-Shiller indices.
 Prices increased (SA) in 7 of the 20 Case-Shiller cities in March seasonally adjusted. Prices in Las Vegas are off 58.3% from the peak, and prices in Dallas only off 7.7% from the peak.
From S&P (NSA):
I'll have more soon ...
 "
"
This includes prices for 20 individual cities and and two composite indices (for 10 cities and 20 cities), plus the Q1 2011 quarterly national house price index.
Note: Case-Shiller reports NSA, I use the SA data.
From S&P:National Home Prices Hit New Low in 2011 Q1
Data through March 2011 ... show that the U.S. National Home Price Index declined by 4.2% in the first quarter of 2011, after having fallen 3.6% in the fourth quarter of 2010. The National Index hit a new recession low with the first quarter’s data and posted an annual decline of 5.1% versus the first quarter of 2010. Nationally, home prices are back to their mid-2002 levels.
...
As of March 2011, 19 of the 20 MSAs covered by S&P/Case-Shiller Home Price Indices and both monthly composites were down compared to March 2010. Twelve of the 20 MSAs and the 20-City Composite also posted new index lows in March. With an index value of 138.16, the 20-City Composite fell below its earlier reported April 2009 low of 139.26. Minneapolis posted a double-digit 10.0% annual decline, the first market to be back in this territory since March 2010 when Las Vegas was down 12.0% on an annual basis. In the midst of all these falling prices and record lows, Washington DC was the only city where home prices increased on both a monthly (+1.1%) and annual (+4.3%) basis.
 Click on graph for larger image in graph gallery.
The first graph shows the nominal seasonally adjusted Composite 10 and Composite 20 indices (the Composite 20 was started in January 2000).
The Composite 10 index is off 31.8% from the peak, and down 0.1% in March (SA). The Composite 10 is still 1.6% above the May 2009 post-bubble bottom (Seasonally adjusted).
The Composite 20 index is off 31.6% from the peak, and down 0.2% in March (SA). The Composite 20 is only 0.1% above the May 2009 post-bubble bottom seasonally adjusted, and at a new post-bubble low not seasonally adjusted (NSA).
 The second graph shows the Year over year change in both indices.
The Composite 10 SA is down 2.8% compared to March 2010.
The Composite 20 SA is down 3.5% compared to March 2010.
The third graph shows the price declines from the peak for each city included in S&P/Case-Shiller indices.
 Prices increased (SA) in 7 of the 20 Case-Shiller cities in March seasonally adjusted. Prices in Las Vegas are off 58.3% from the peak, and prices in Dallas only off 7.7% from the peak.
From S&P (NSA):
“This month’s report is marked by the confirmation of a double-dip in home prices across much of the nation. The National Index, the 20-City Composite and 12 MSAs all hit new lows with data reported through March 2011. ... Home prices continue on their downward spiral with no relief in sight.” says David M. Blitzer, Chairman of the Index Committee at S&P Indices. “Since December 2010, we have found an increasing number of markets posting new lows. In March 2011, 12 cities - Atlanta, Charlotte, Chicago, Cleveland, Detroit, Las Vegas, Miami, Minneapolis, New York, Phoenix, Portland (OR) and Tampa - fell to their lowest levels as measured by the current housing cycle. Washington D.C. was the only MSA displaying positive trends with an annual growth rate of +4.3% and a 1.1% increase from its February level.There could be some confusion between the SA and NSA numbers. The National index and Composite 20 (NSA) are both at new post-bubble lows.
I'll have more soon ...
Comments